Suppose an AI model outperforms another model on a benchmark of interest—testing its general knowledge, for example, or its ability to solve computer-coding questions. Is the difference in capabilities real, or could one model simply have gotten lucky in the choice of questions on the benchmark?
With the amount of public interest in AI model evaluations—informally called “evals”—this question remains surprisingly understudied among the AI research community. This month, we published a new research paper that attempts to answer the question rigorously. Drawing on statistical theory and the experiment design literature, the paper makes a number of recommendations to the AI research community for reporting eval results in a scientifically informative way. In this post, we briefly go over the reporting recommendations, and the logic behind them.
Recommendation #1: Use the Central Limit Theorem
Evals often consist of hundreds or thousands of unrelated questions. MMLU, for instance, contains questions as diverse as:
- Who discovered the first virus?
- What is the inverse of 𝑓(𝑥)=4−5𝑥?
- Who said that “Jurisprudence is the eye of law”?
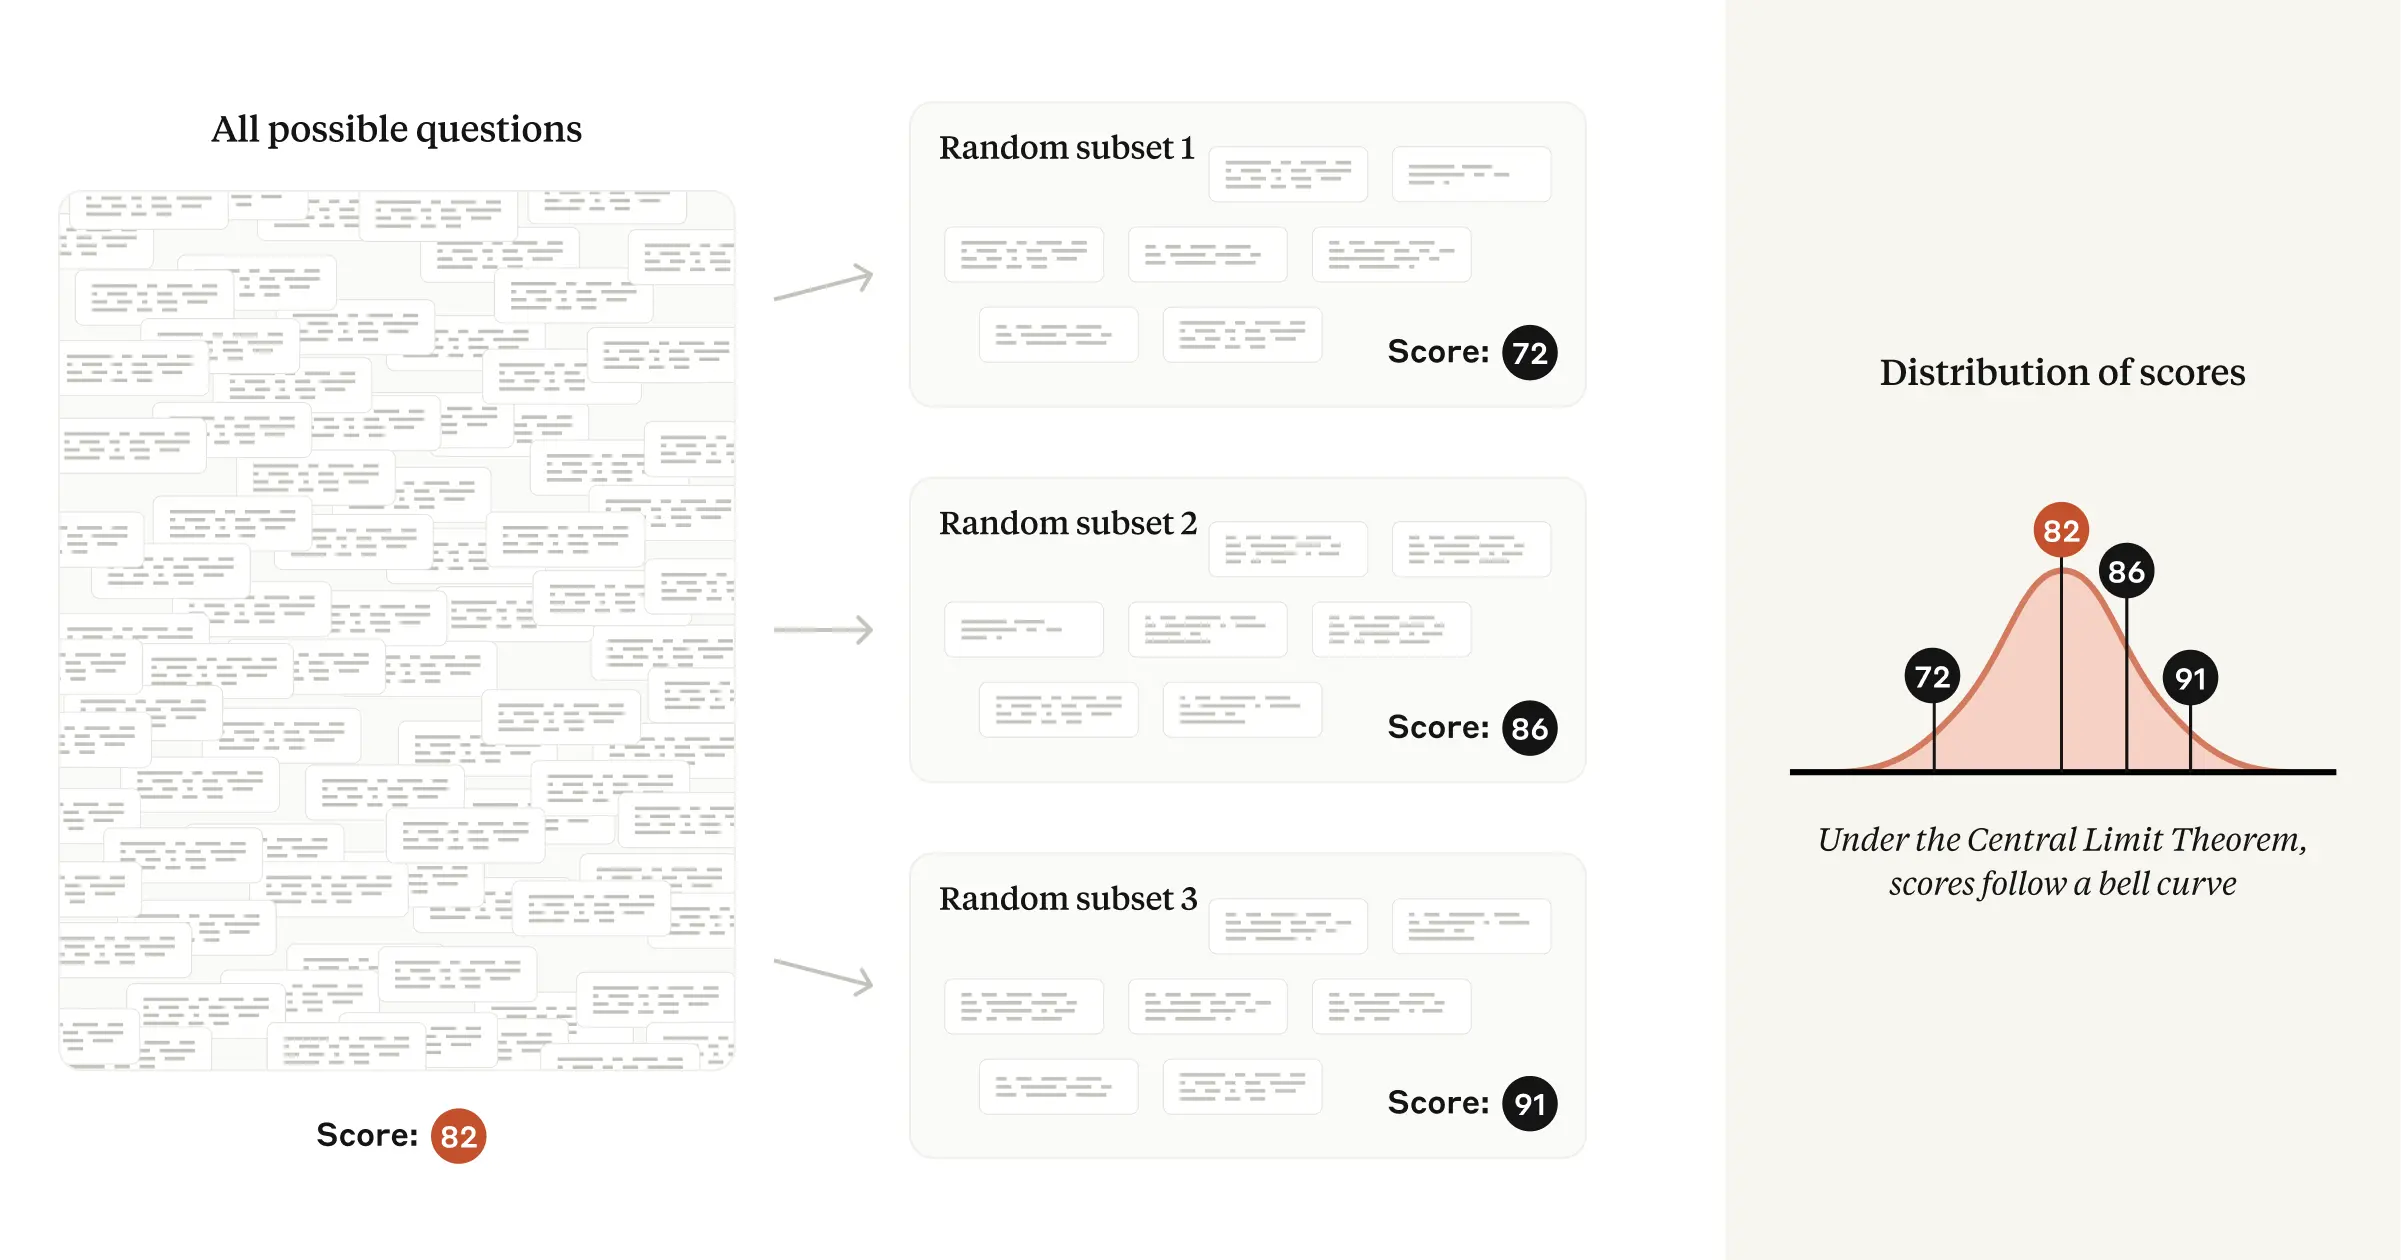
To compute an overall eval score, each question is separately scored, and then the overall score is (usually) a simple average of these question scores. Typically, researchers focus their attention on this observed average. But in our paper, we argue that the real object of interest should not be the observed average, but rather the theoretical average across all possible questions. So if we imagine that eval questions were drawn from an unseen “question universe,” we can learn about the average score in that universe—that is, we can measure the underlying skill, independent of the “luck of the draw”—using statistical theory.

This formulation buys us analytic robustness: if a new eval were to be created with questions having the same difficulty distribution as the original eval, we should generally expect our original conclusions to hold.
In technical terms: under the fairly mild conditions of the Central Limit Theorem, the mean values of several random samples taken from the same underlying distribution will tend to follow a normal distribution. The standard deviation (or width) of that normal distribution is commonly known as the standard error of the mean, or SEM. In our paper, we encourage researchers to report the SEM, derived from the Central Limit Theorem, alongside each calculated eval score—and we show researchers how to use the SEM to quantify the difference in theoretical means between two models. A 95% confidence interval can be calculated from the SEM by adding and subtracting 1.96 × SEM from the mean score.
Recommendation #2: Cluster standard errors
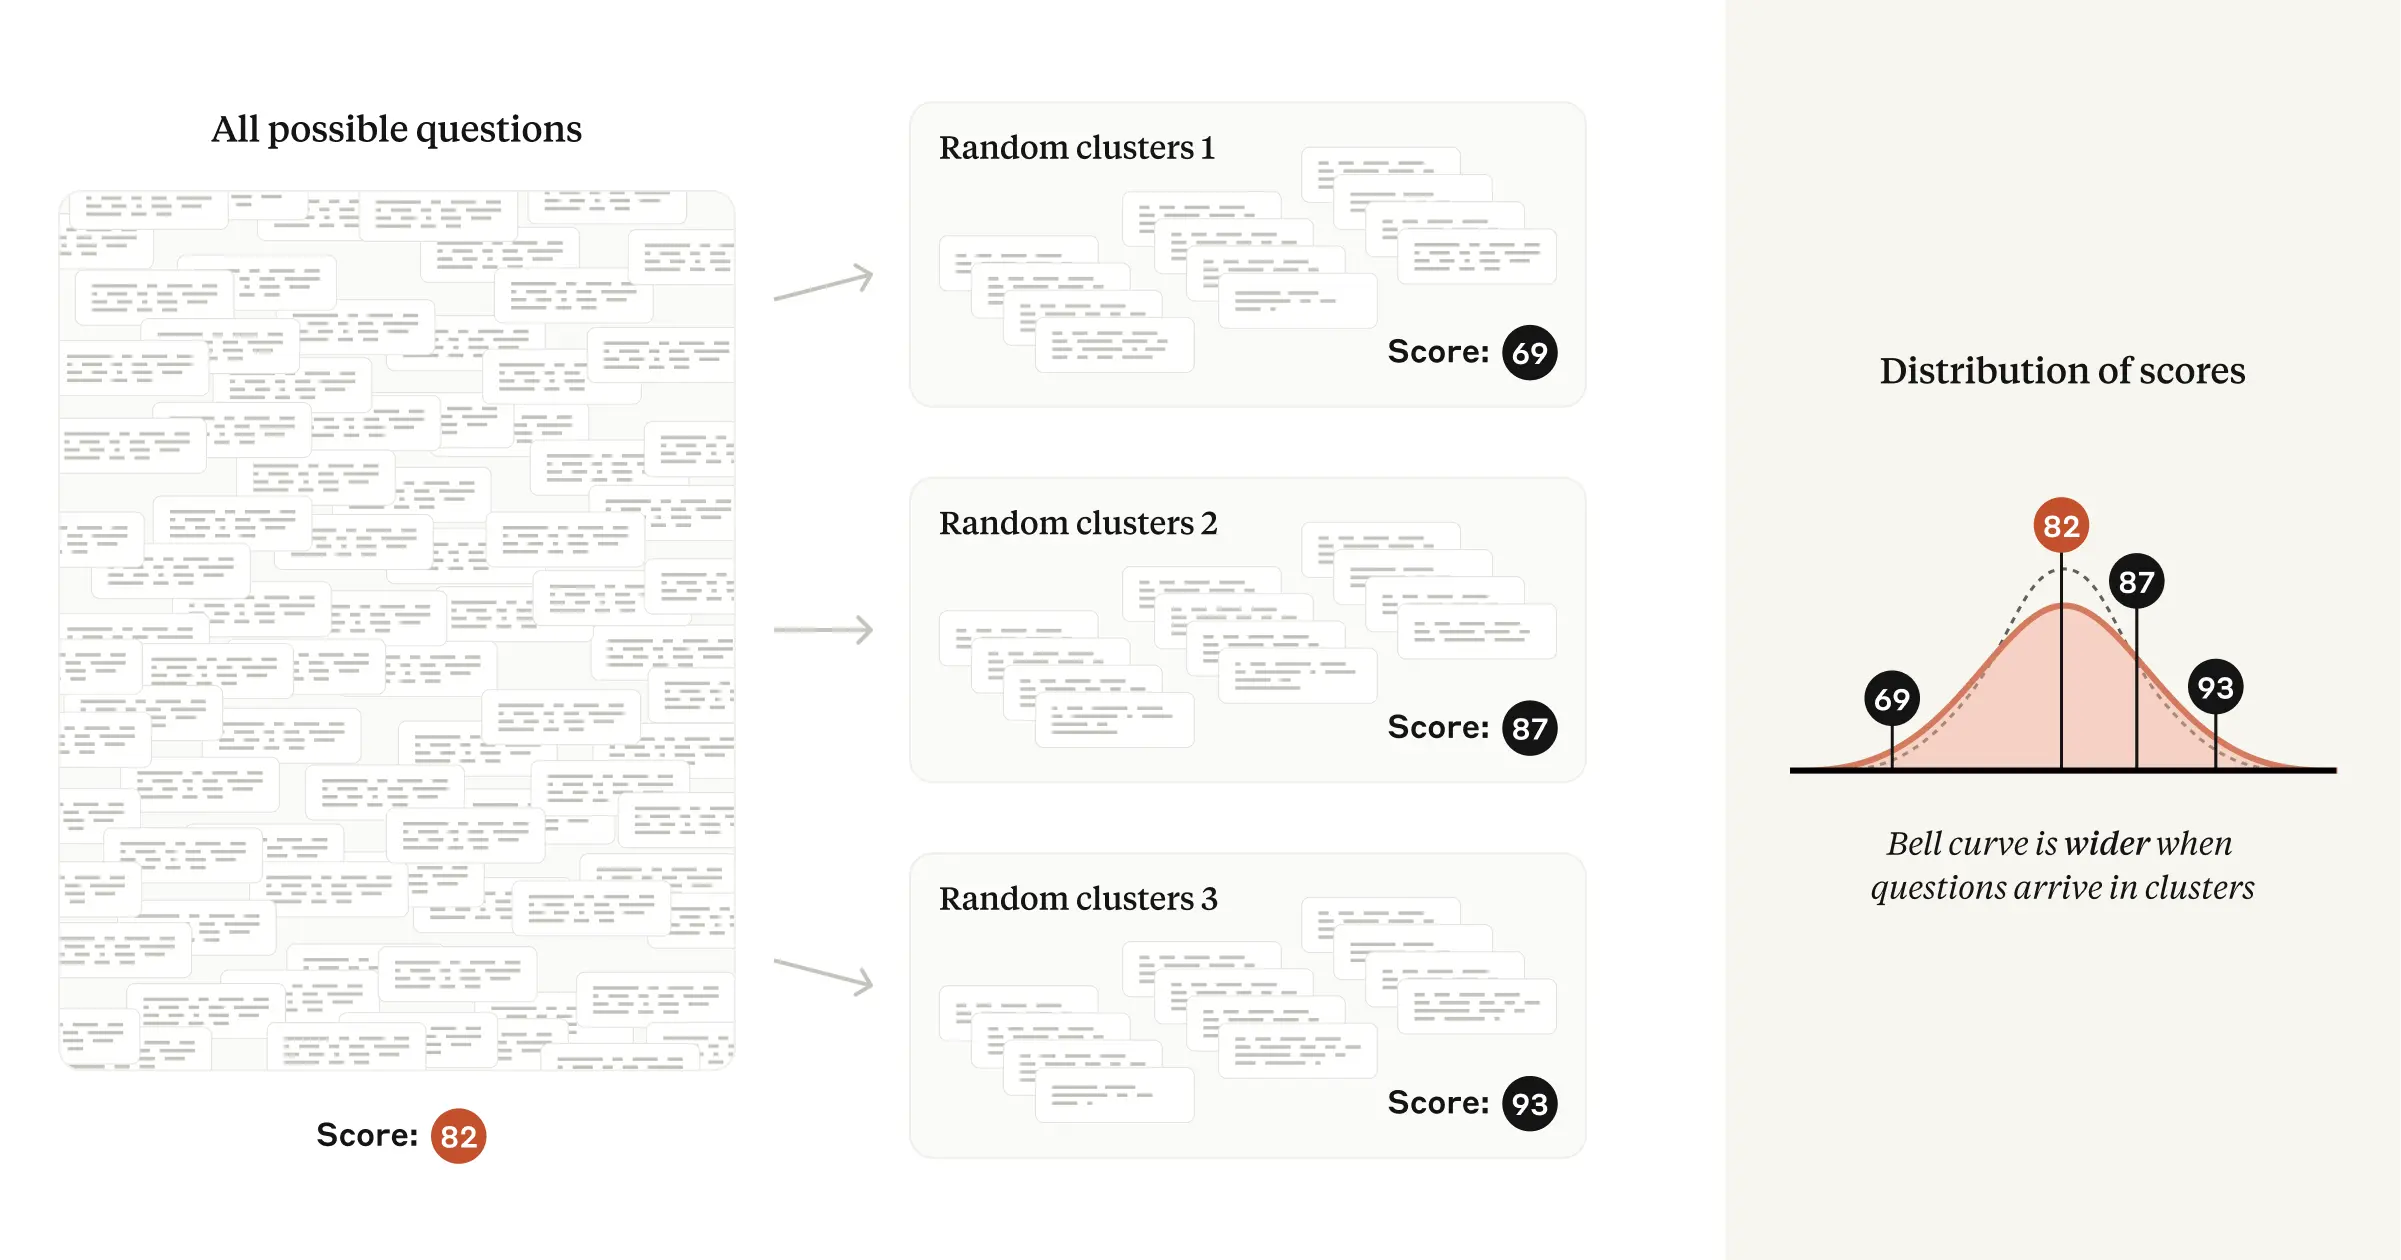
Many evals violate the above assumption of independently selected questions, and instead consist of groups of closely related questions. For example, several questions in a reading-comprehension eval may ask about the same passage of text. Popular evals that follow this pattern include DROP, QuAC, RACE, and SQuAD.
For these evals, each question’s selection from the “question universe” is no longer independent. Because including several questions about the same passage of text will yield less information than selecting the same number of questions about different passages of text, a naive application of the Central Limit Theorem to the case of non-independent questions will lead us to underestimate the standard error—and potentially mislead analysts into drawing incorrect conclusions from the data.
Fortunately, the problem of clustered standard errors has been extensively studied in the social sciences. When the inclusion of questions is non-independent, we recommend clustering standard errors on the unit of randomization (for example, passage of text), and we provide applicable formulas in our paper.

In practice, we have found that clustered standard errors on popular evals can be over three times as large as naive standard errors. Ignoring question clustering may lead researchers to inadvertently detect a difference in model capabilities when in fact none exists.
Recommendation #3: Reduce variance within questions
Variance is a measurement of how spread-out a random variable is. The variance of an eval score is the square of the standard error of the mean, discussed above; this quantity depends on the amount of variance in the score on each individual eval question.
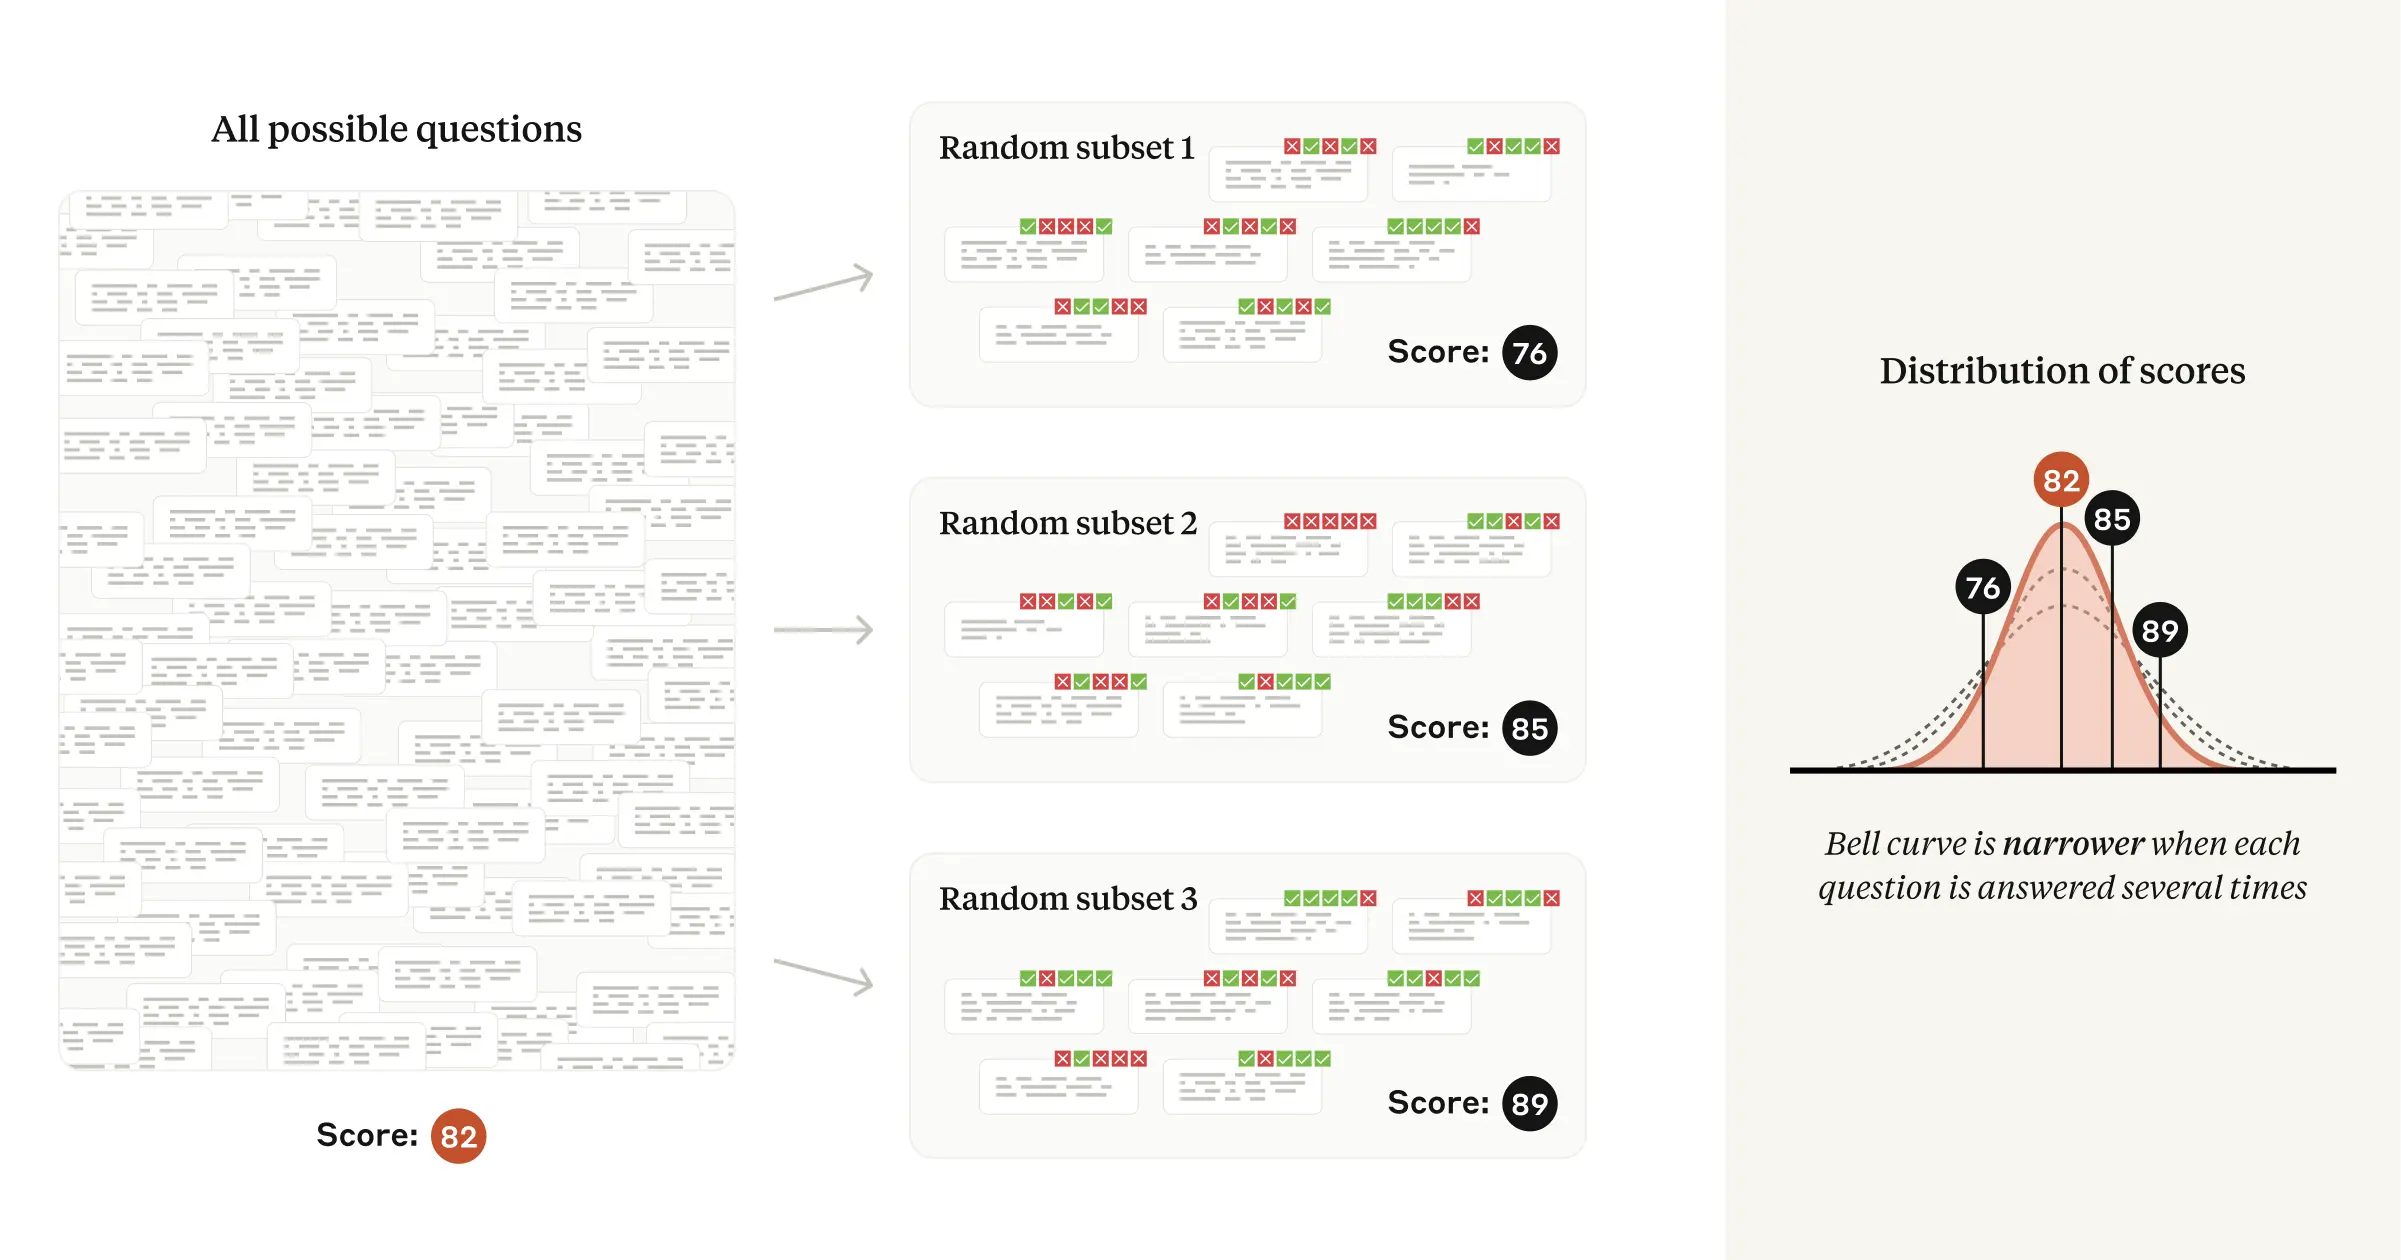
A key insight of our paper is to decompose a model’s score on a particular question into two terms that are added together:
- The mean score (the average score that the model would achieve if asked the same question an infinite number of times—even if the model might produce a different answer each time); and
- A random component (the difference between a realized question score and the mean score for that question).
Thanks to the law of total variance, reducing the variance in the random component directly leads to a smaller standard error of the overall mean, and thus greater statistical precision. Our paper highlights two strategies for reducing variance in the random component depending on whether or not the model is asked to think step by step before answering (a prompting technique known as CoT, or chain-of-thought reasoning).
If an eval uses chain-of-thought reasoning, we recommend resampling answers from the same model several times, and using the question-level averages as the question scores fed into the Central Limit Theorem. We note that the Inspect framework correctly computes standard errors in this way via its epochs parameter.

If the eval does not use chain-of-thought reasoning (i.e., its answers are not “path dependent”), we note that the random component in the score may often be eliminated altogether using next-token probabilities from the language model. For example, if the correct answer to a multiple-choice question is “B”, we would simply use the probability of the model producing the token “B” as the question score. We are not aware of an open-source evals framework which implements this technique.
Recommendation #4: Analyze paired differences
Eval scores don’t have any meaning on their own; they only make sense in relation to one another (one model outperforms another model, or ties another model, or outperforms a person). But could a measured difference between two models be due to the specific choice of questions in the eval, and randomness in the models’ answers? We can find out with a two-sample t-test, using only the standard errors of the mean calculated from both eval scores.
However, a two-sample test ignores the hidden structure inside eval data. Since the question list is shared across models, conducting a paired-differences test lets us eliminate the variance in question difficulty and focus on the variance in responses. In our paper, we show how the result of a paired-differences test will be related to the Pearson correlation coefficient between two models’ question scores. When the correlation coefficient is higher, the standard error of the mean difference will be smaller.
In practice, we find the correlation of question scores on popular evals between frontier models to be substantial—between 0.3 and 0.7 on a scale of −1 to +1. Put another way, frontier models have an overall tendency to get the same questions right and wrong. Paired-difference analysis thus represents a “free” variance reduction technique that is very well suited for AI model evals. Therefore, in the interest of extracting the clearest signal from the data, our paper recommends reporting pairwise information—mean differences, standard errors, confidence intervals, and correlations—whenever two or more models are being compared.
Recommendation #5: Use power analysis
The flip side of the statistical significance coin is statistical power, which is the ability of a statistical test to detect a difference between two models, assuming such a difference exists. If an eval doesn’t have very many questions, confidence intervals associated with any statistical tests will tend to be wide. This means that models will need to have a large underlying difference in capabilities in order to register a statistically significant result—and that small differences will likely go undetected. Power analysis refers to the mathematical relationship between observation count, statistical power, the false positive rate, and the effect size of interest.
In our paper, we show how to apply concepts from power analysis to evals. Specifically, we show researchers how to formulate a hypothesis (such as Model A outperforms Model B by 3 percentage points) and calculate the number of questions that an eval should have in order to test this hypothesis against the null hypothesis (such as Model A and Model B are tied).
We believe that power analysis will prove helpful to researchers in a number of situations. Our power formula will inform evaluators of models about the number of times to re-sample answers from questions (see Recommendation #3 above), as well as the number of questions that may be included in a random subsample while retaining the desired power properties. Researchers might use the power formula to conclude that an eval with a limited number of available questions is not worth running on a particular pair of models. Developers of new evals may wish to use the formula to help decide how many questions to include.
Conclusion
Statistics is the science of measurement in the presence of noise. Evals present a number of practical challenges, and a true science of evals remains underdeveloped. Statistics can only form one aspect of a science of evals—but a critical one, as an empirical science is only as good as its measuring tools. We hope that the recommendations in our paper Adding Error Bars to Evals: A Statistical Approach to Language Model Evaluations will help AI researchers calculate, interpret, and communicate eval numbers with greater precision and clarity than before—and we encourage researchers in the AI community to explore other techniques from experiment design so that they may understand more exactly all the things that they want to measure.