
In the coming years, AI systems will have a major impact on the ways people work. For that reason, we're launching the Anthropic Economic Index, an initiative aimed at understanding AI's effects on labor markets and the economy over time.
The Index’s initial report provides first-of-its-kind data and analysis based on millions of anonymized conversations on Claude.ai, revealing the clearest picture yet of how AI is being incorporated into real-world tasks across the modern economy.
We're also open sourcing the dataset used for this analysis, so researchers can build on and extend our findings. Developing policy responses to address the coming transformation in the labor market and its effects on employment and productivity will take a range of perspectives. To that end, we are also inviting economists, policy experts, and other researchers to provide input on the Index.
The main findings from the Economic Index’s first paper are:
- Today, usage is concentrated in software development and technical writing tasks. Over one-third of occupations (roughly 36%) see AI use in at least a quarter of their associated tasks, while approximately 4% of occupations use it across three-quarters of their associated tasks.
- AI use leans more toward augmentation (57%), where AI collaborates with and enhances human capabilities, compared to automation (43%), where AI directly performs tasks.
- AI use is more prevalent for tasks associated with mid-to-high wage occupations like computer programmers and data scientists, but is lower for both the lowest- and highest-paid roles. This likely reflects both the limits of current AI capabilities, as well as practical barriers to using the technology.
See below for further details on our initial findings.
Mapping AI usage across the labor market
Our new paper builds on a long line of research on the labor market impact of technologies, from the Spinning Jenny of the Industrial Revolution to the car-manufacturing robots of the present day. We focus on the ongoing impact of AI. We don’t survey people on their AI use, or attempt to forecast the future; instead, we have direct data on how AI is actually being used.
Analyzing occupational tasks
Our research began with an important insight from the economics literature: sometimes it makes sense to focus on occupational tasks rather than occupations themselves. Jobs often share certain tasks and skills in common: for example, visual pattern recognition is a task performed by designers, photographers, security screeners, and radiologists.
Certain tasks lend themselves better to being automated or augmented by a new technology than others. We’d therefore expect AI to be adopted selectively for different tasks across different occupations, and that analyzing tasks—in addition to jobs as a whole—would give us a fuller picture of how AI is being integrated into the economy.
Using Clio to match AI use to tasks
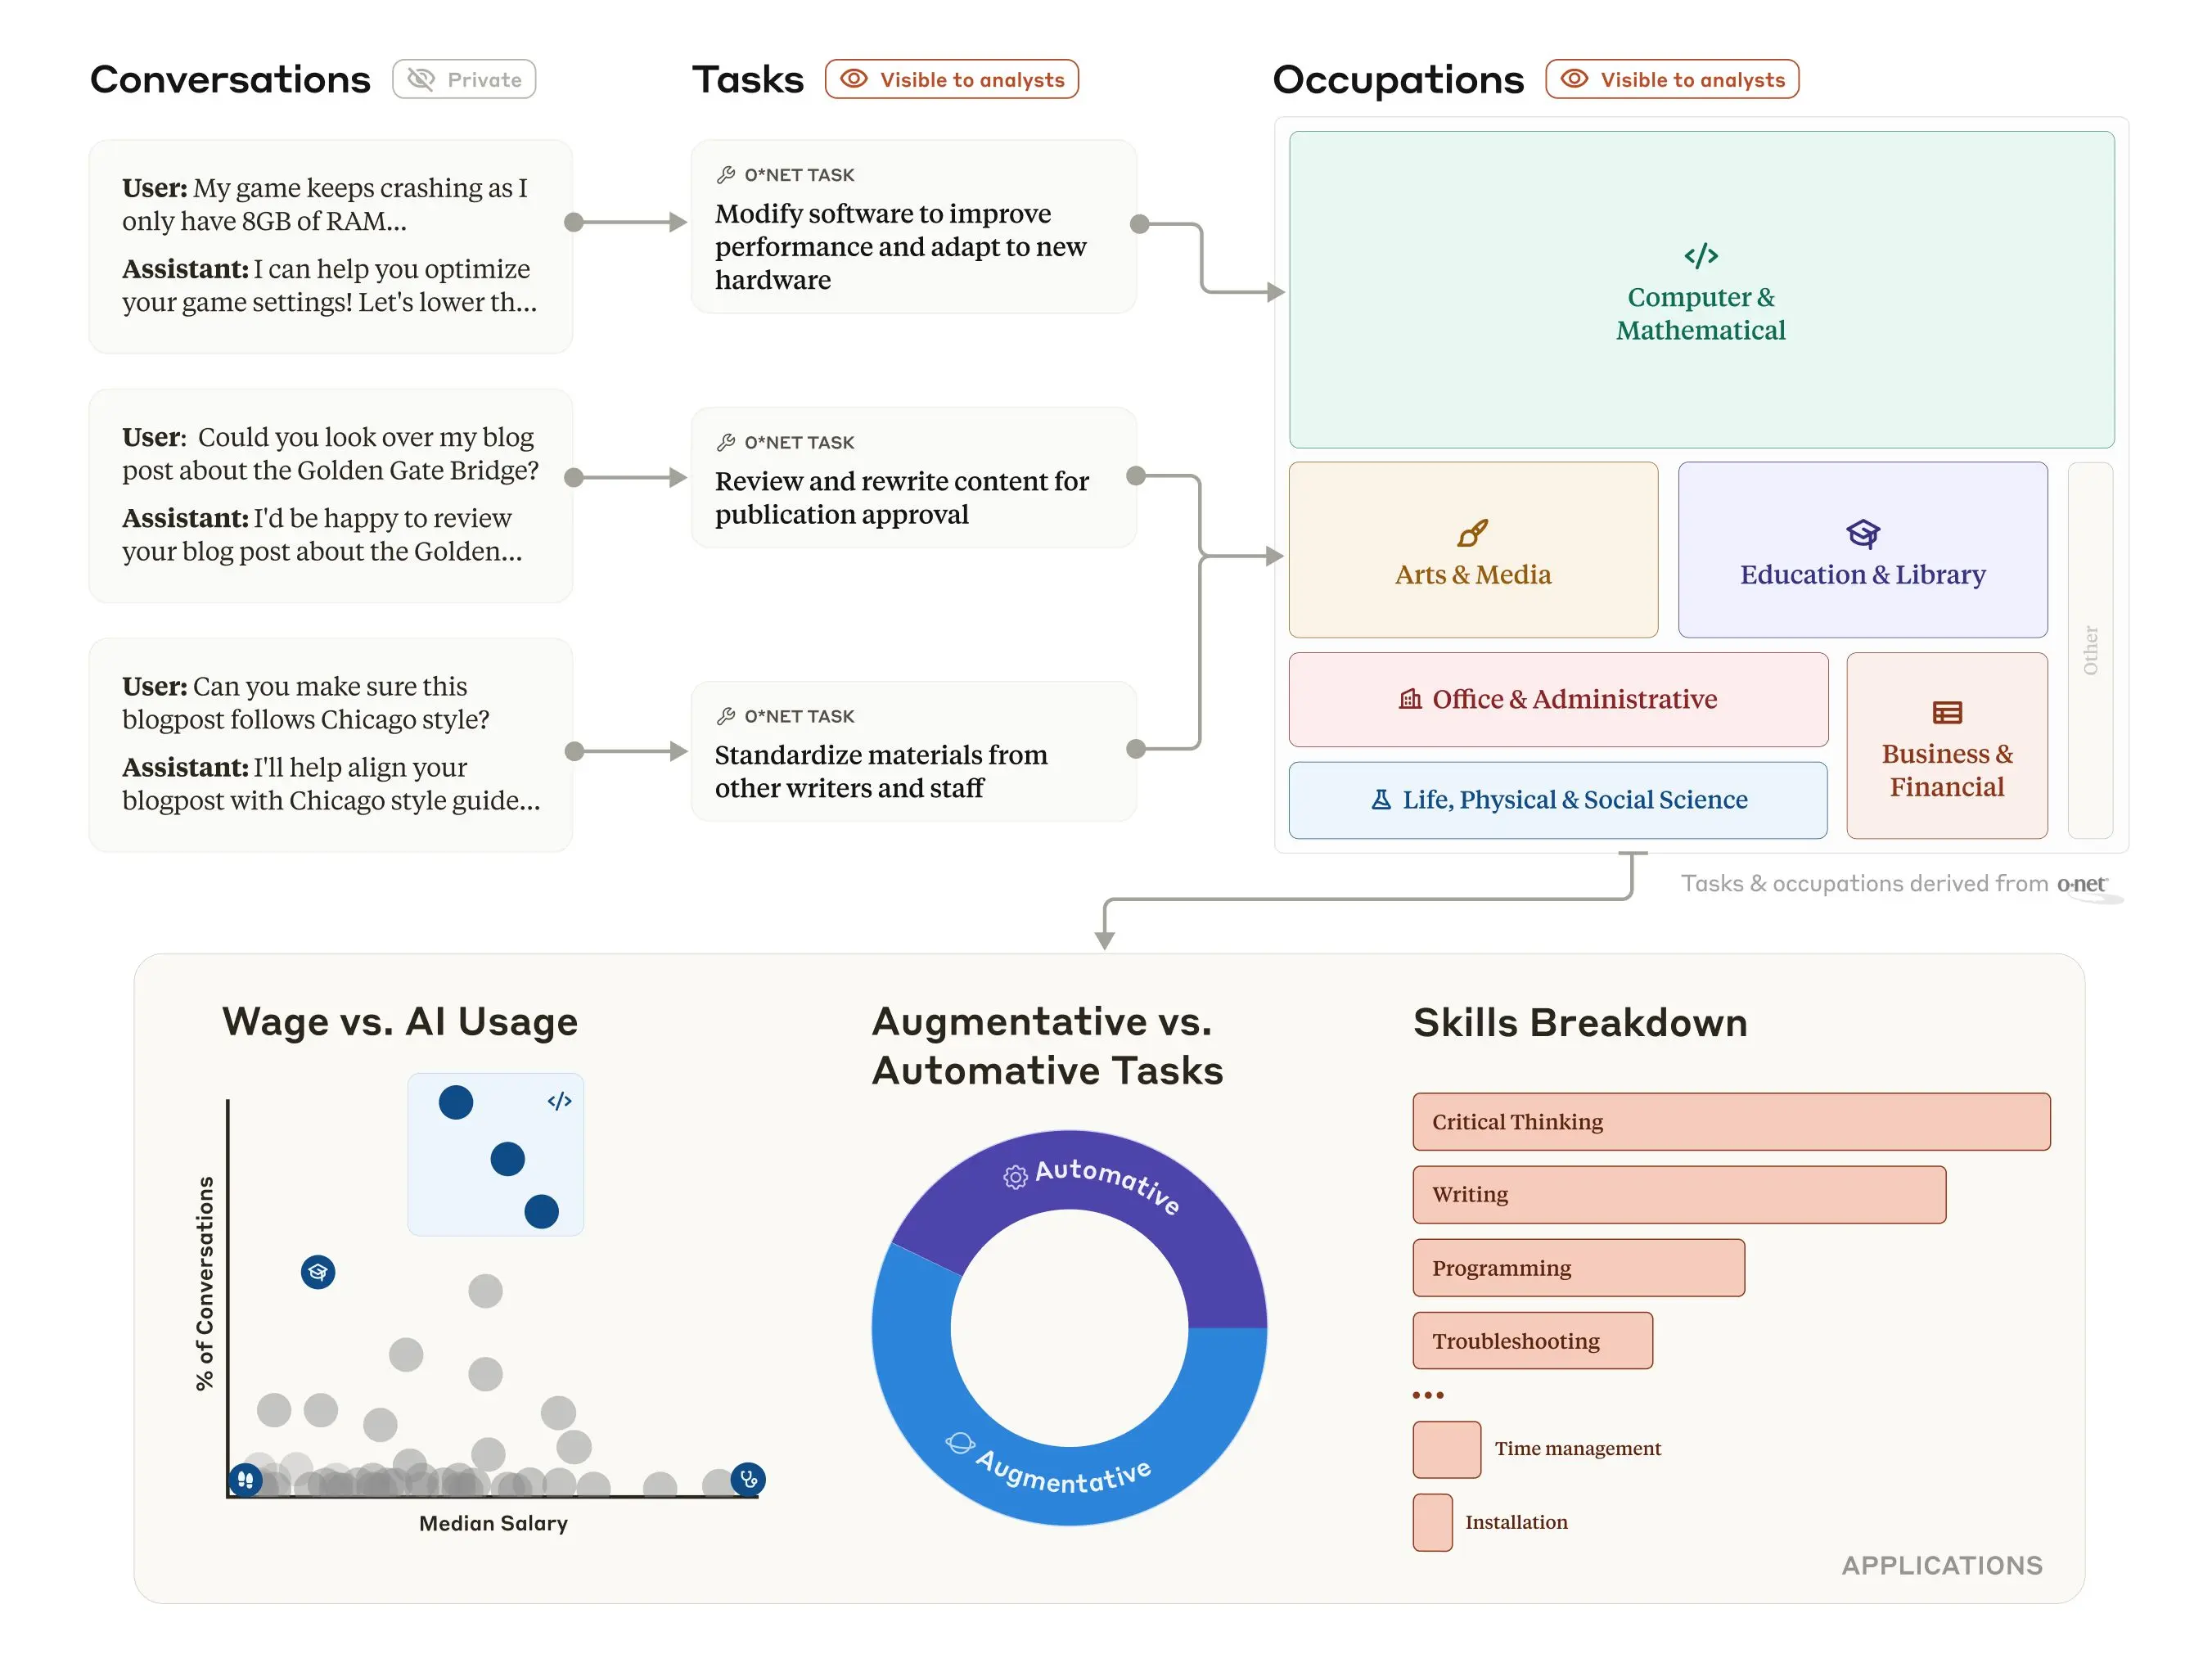
This research was made possible by Claude insights and observations, or "Clio", an automated analysis tool that allows us to analyze conversations with Claude while preserving user privacy1. We used Clio on a dataset of approximately one million conversations with Claude (specifically, Free and Pro conversations on Claude.ai), and used it to organize the conversations by occupational task.
We chose tasks according to the classification made by the U.S. Department of Labor, which maintains a database of around 20,000 specific work-related tasks called the Occupational Information Network, or O*NET. Clio matched each conversation with the O*NET task that best represented the role of the AI in the conversation (the process is summarized in the figure below). We then followed the O*NET scheme for grouping the tasks into the occupations they best represented, and the occupations into a small set of overall categories: education and library, business and financial, and so on.
Results
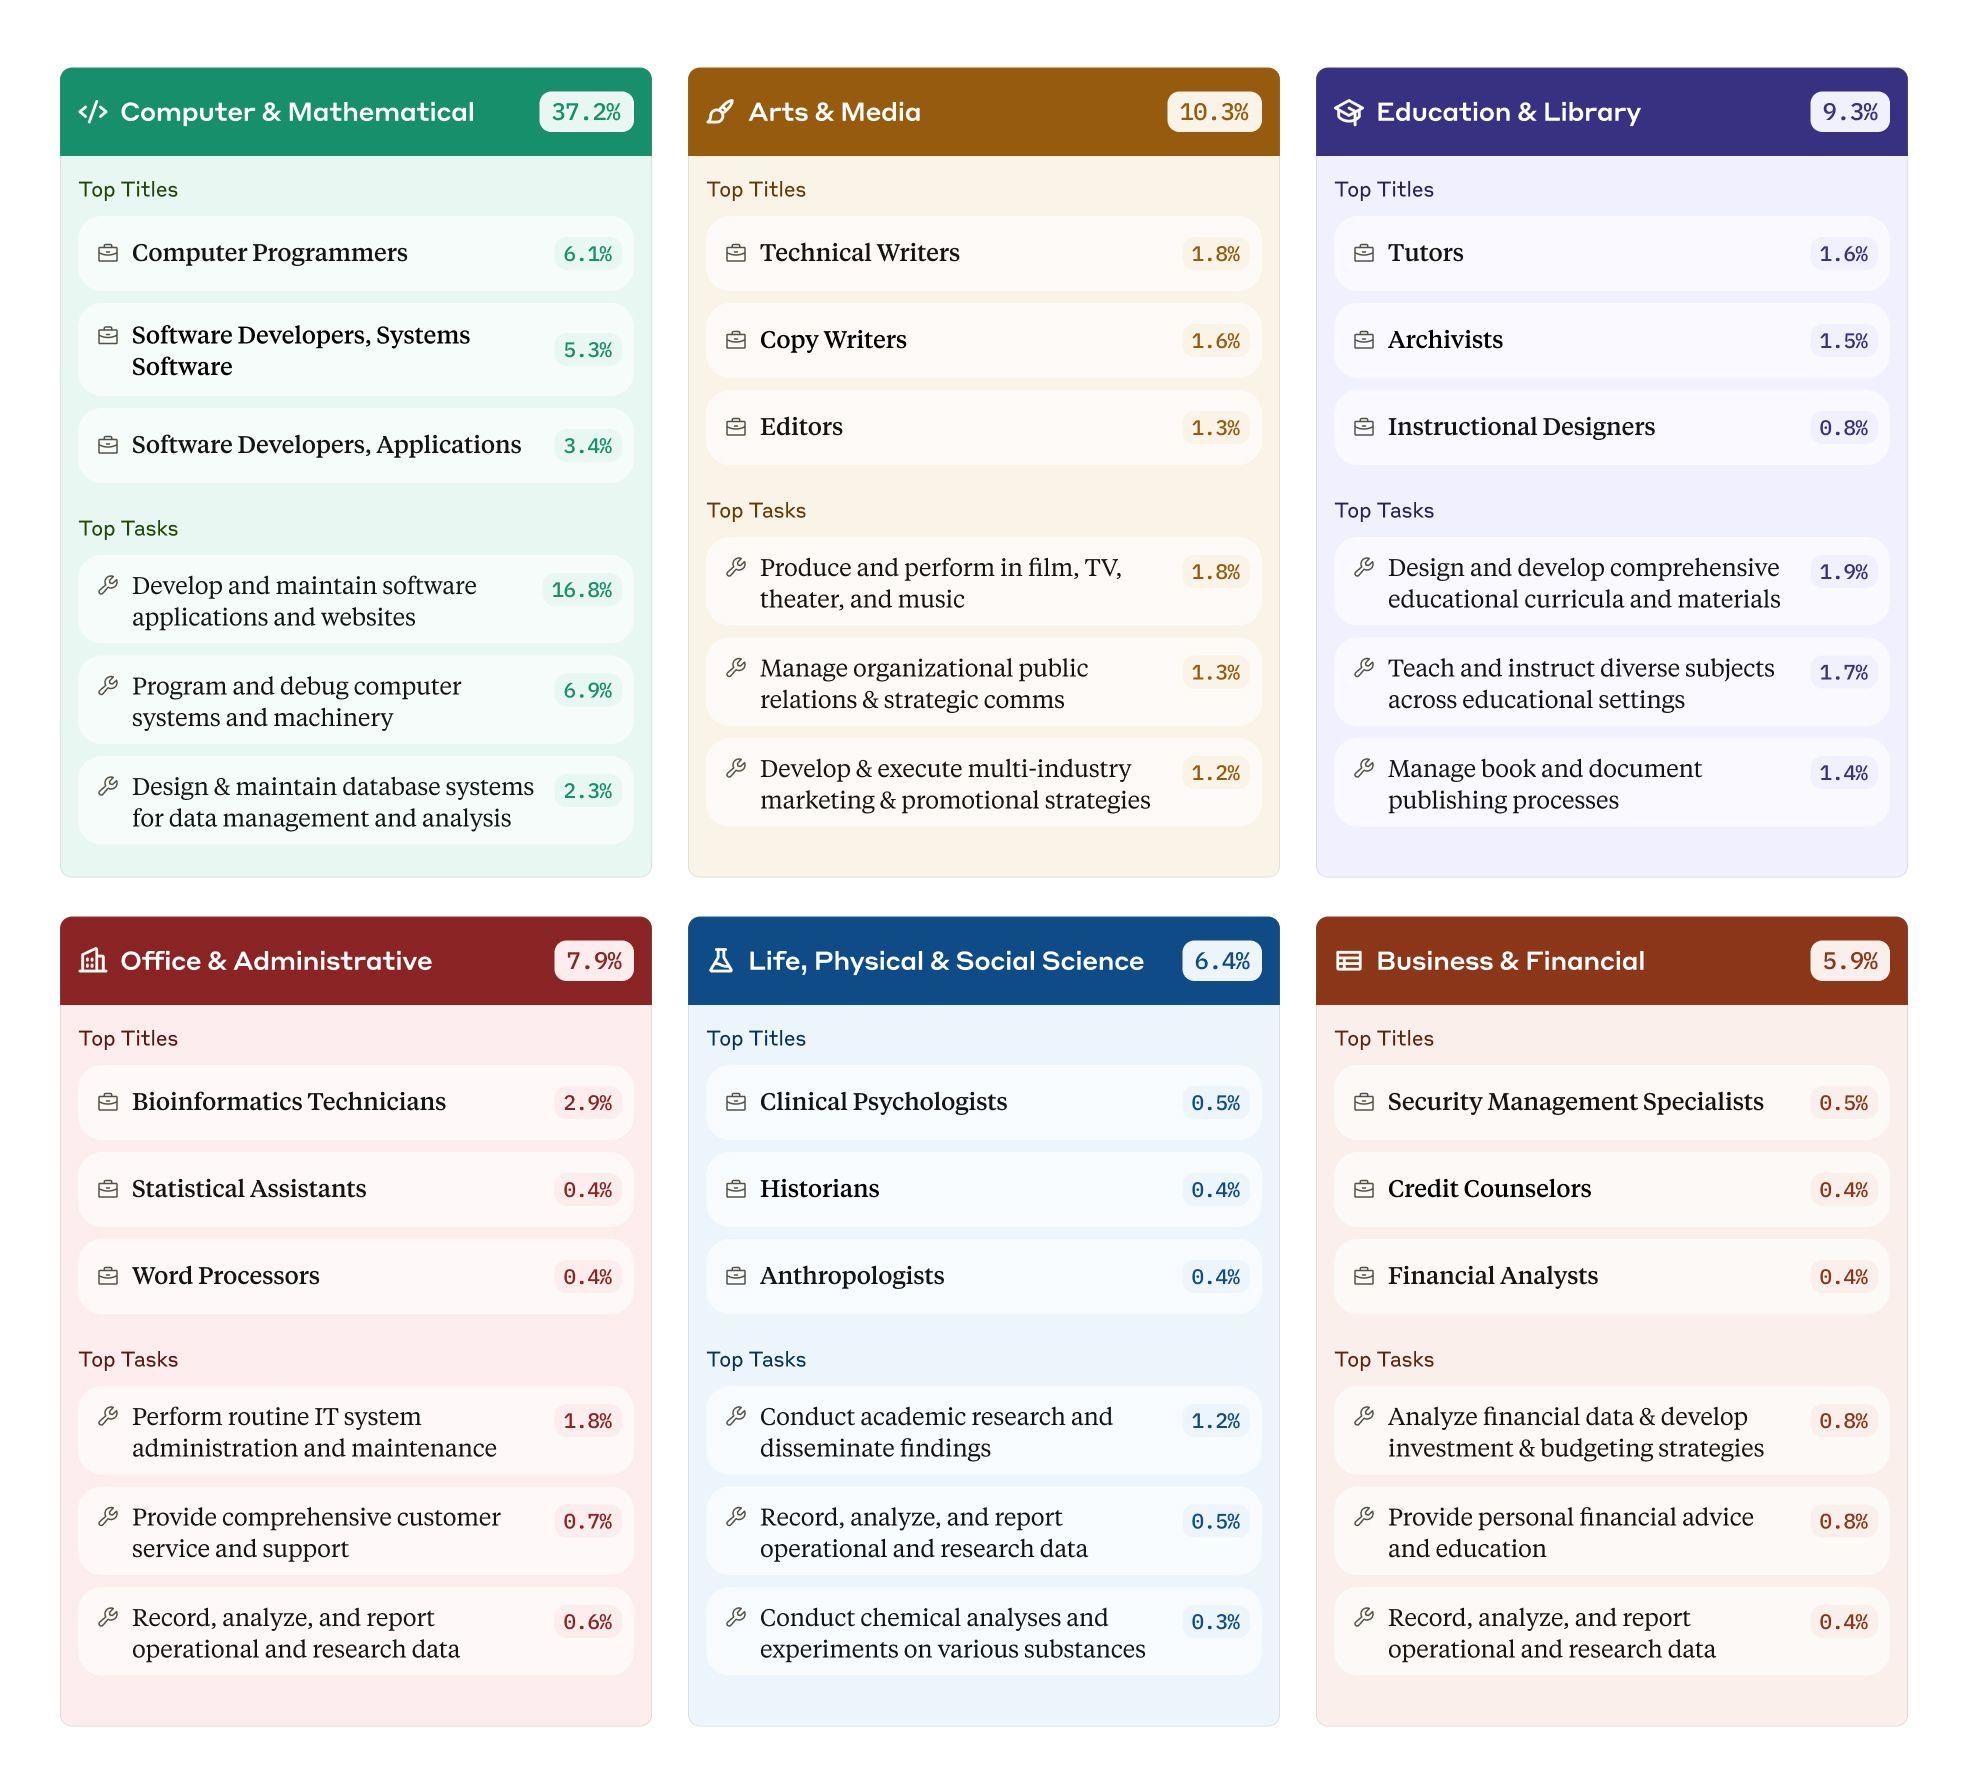
Uses of AI by job type. The tasks and occupations with by far the largest adoption of AI in our dataset were those in the “computer and mathematical” category, which in large part covers software engineering roles. 37.2% of queries sent to Claude were in this category, covering tasks like software modification, code debugging, and network troubleshooting.
The second largest category was “arts, design, sports, entertainment, and media” (10.3% of queries), which mainly reflected people using Claude for various kinds of writing and editing. Unsurprisingly, occupations involving a high degree of physical labor, such as those in the “farming, fishing, and forestry” category (0.1% of queries), were least represented.
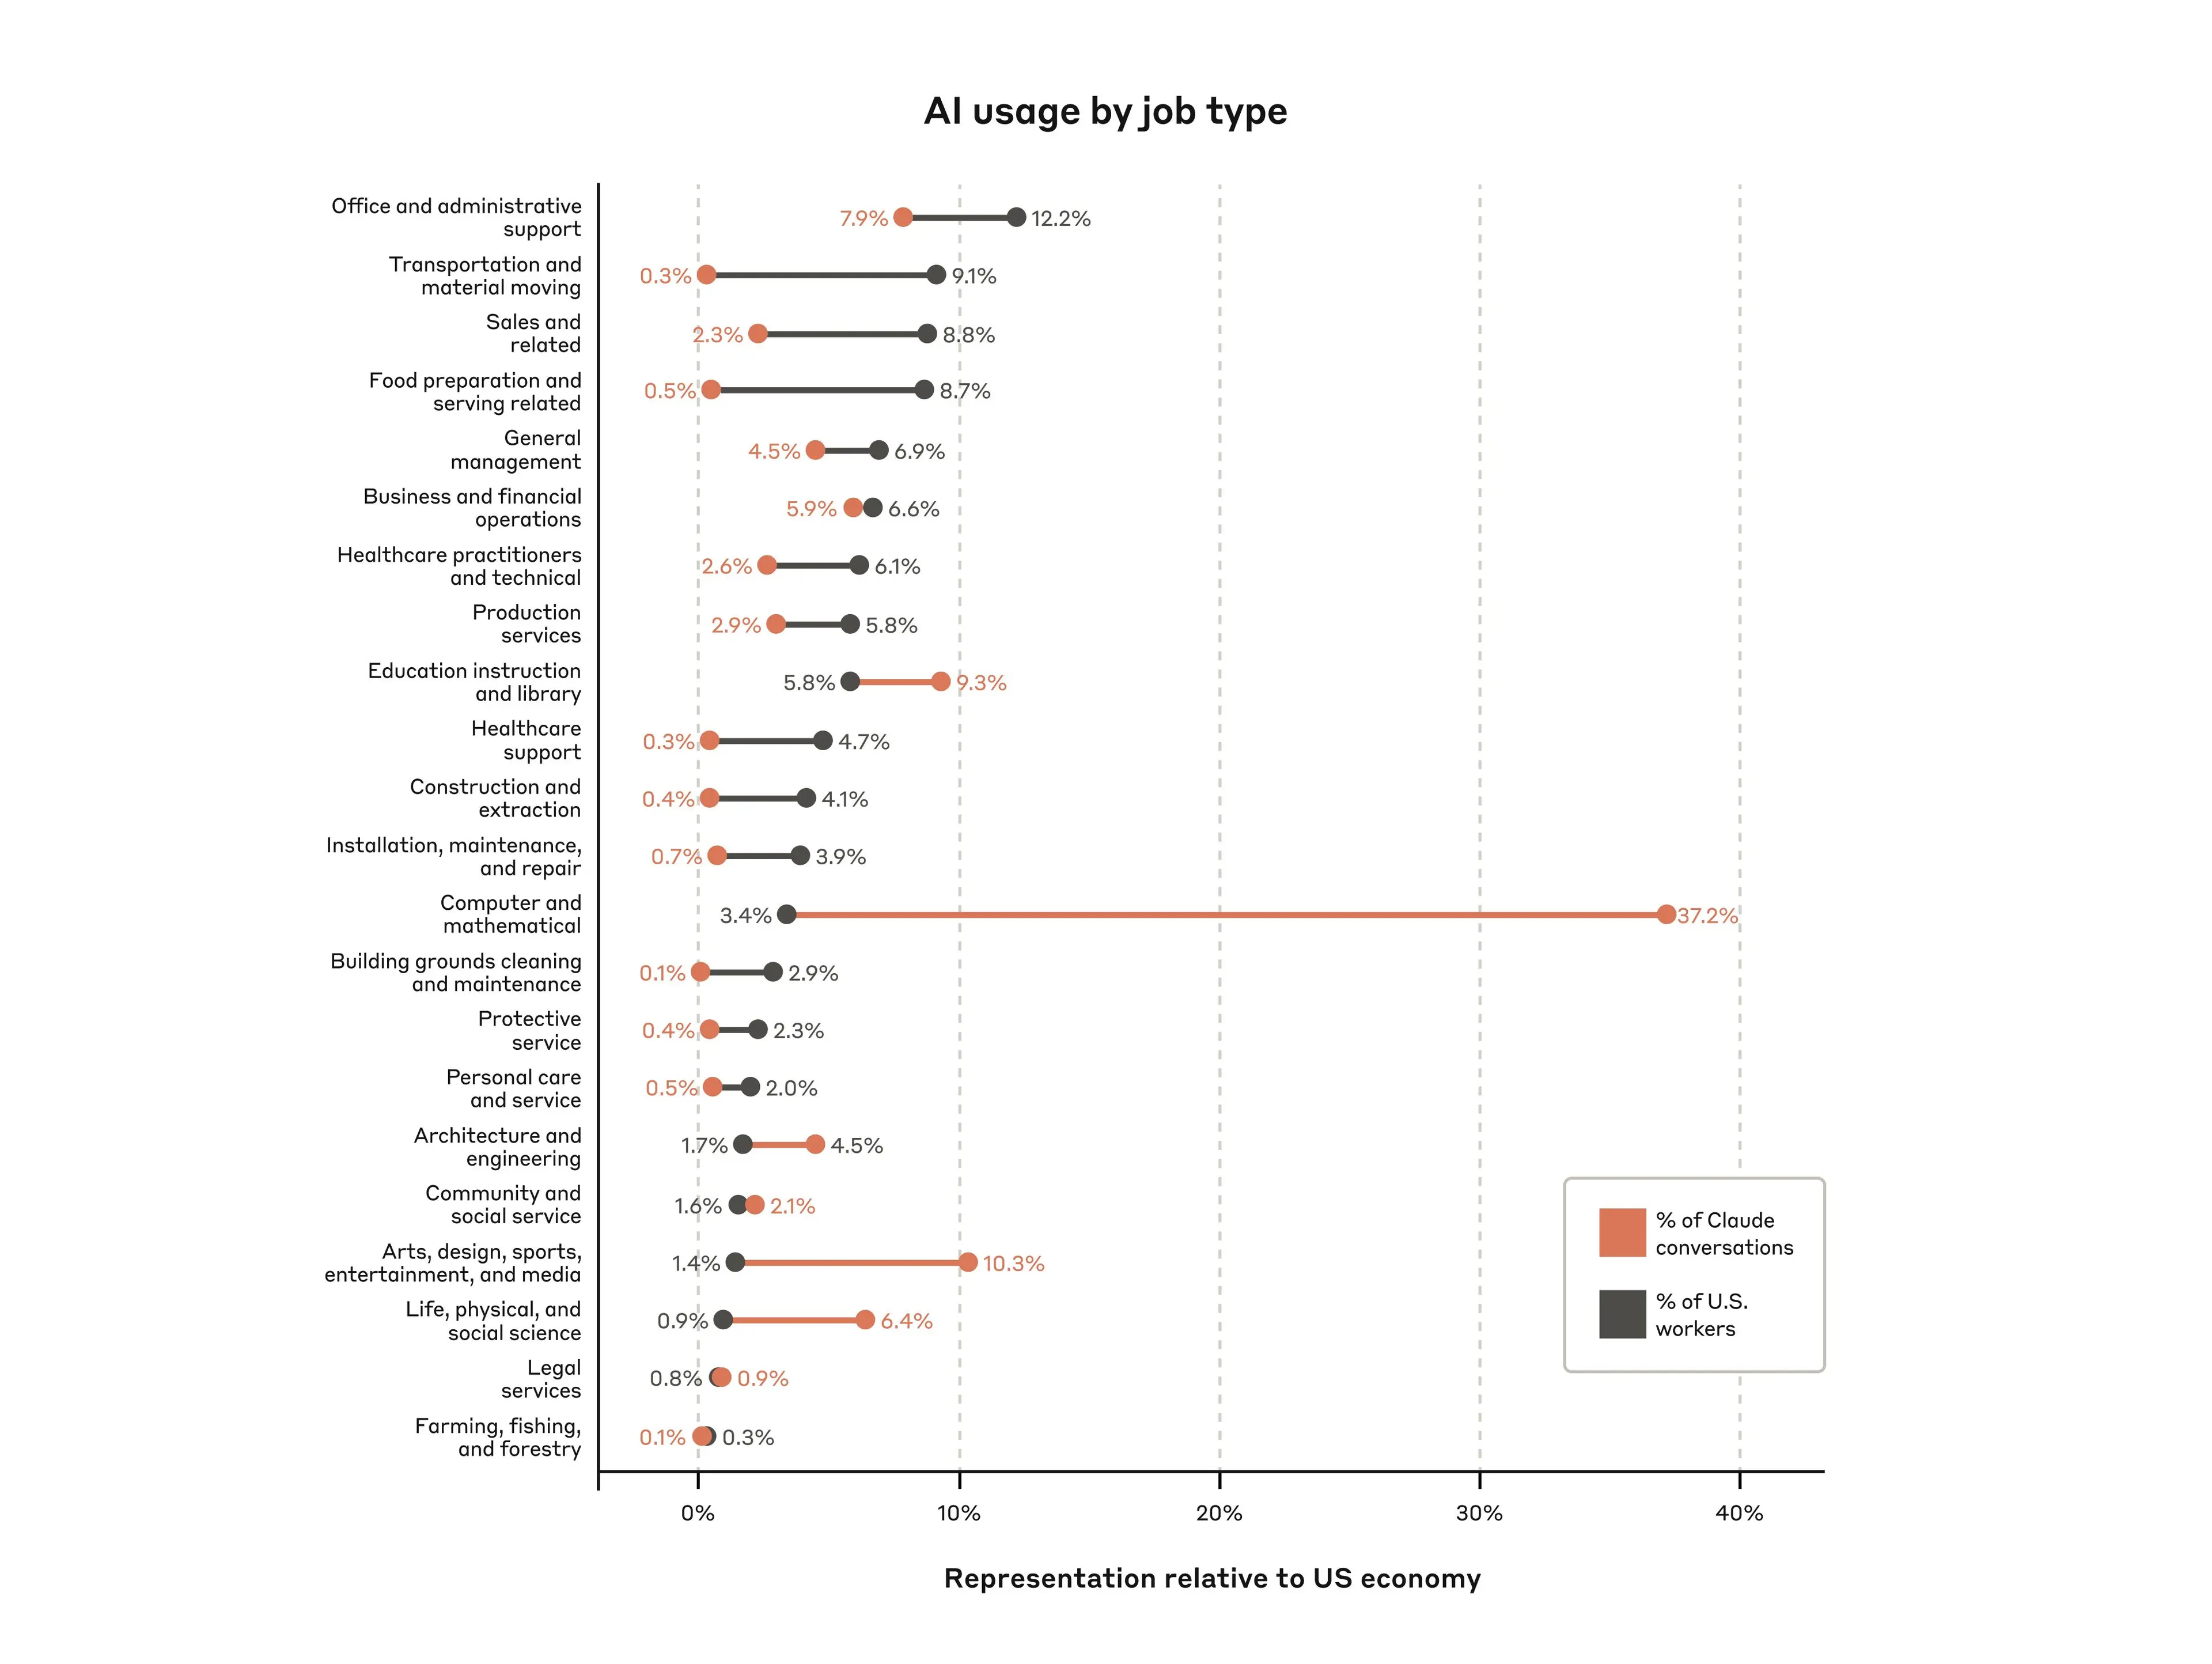
We also compared the rates in our data to the rates at which each occupation appeared in the labor market in general. The comparisons are shown in the figure below.
Depth of AI use within occupations. Our analysis found that very few occupations see AI use across most of their associated tasks: only approximately 4% of jobs used AI for at least 75% of tasks. However, more moderate use of AI is much more widespread: roughly 36% of jobs had some use of AI for at least 25% of their tasks.
As we predicted, there wasn’t evidence in this dataset of jobs being entirely automated: instead, AI was diffused across the many tasks in the economy, having stronger impacts for some groups of tasks than others.
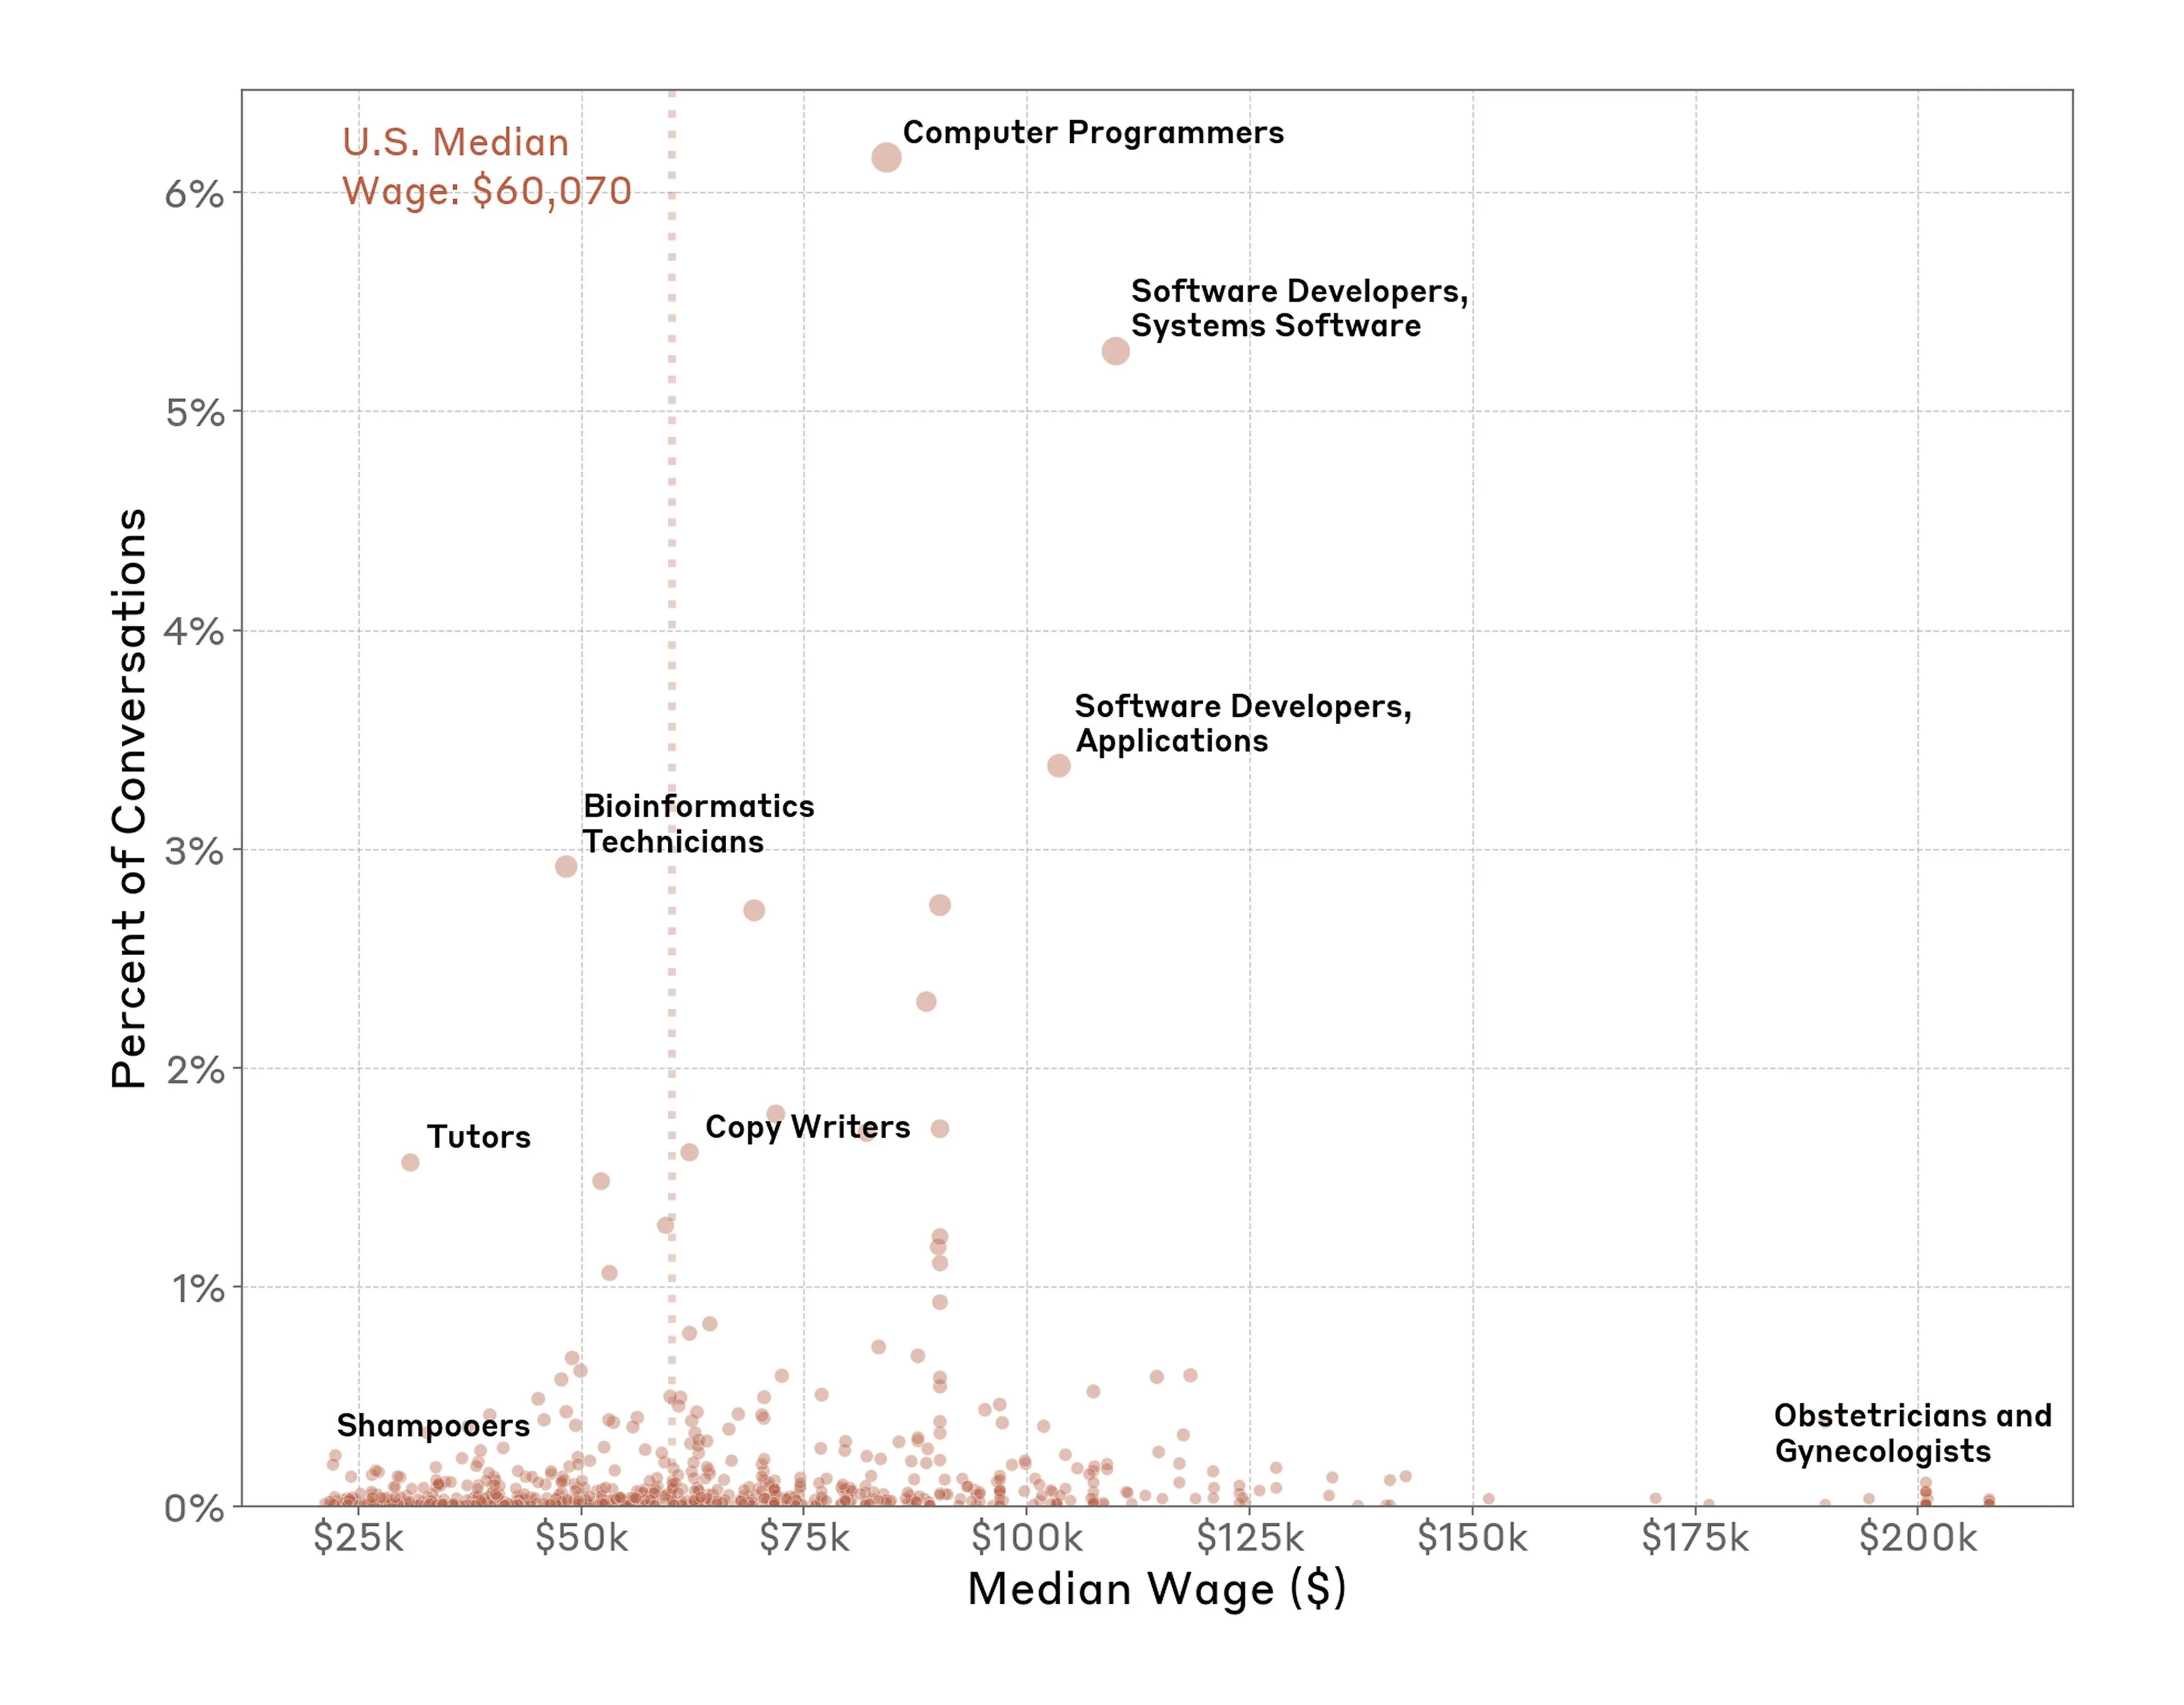
AI use and salary. The O*NET database provides the median U.S. salary for each of the occupations listed. We added this information to our analysis, allowing us to compare professions’ median salaries and the level of AI use in their corresponding tasks.
Interestingly, both low-paying and very-high-paying jobs had very low rates of AI use (these were generally jobs involving a large degree of manual dexterity, such as shampooers and obstetricians). It was specific occupations in the mid-to-high median salary ranges, like computer programmers and copywriters, who were—in our data—among the heaviest users of AI.
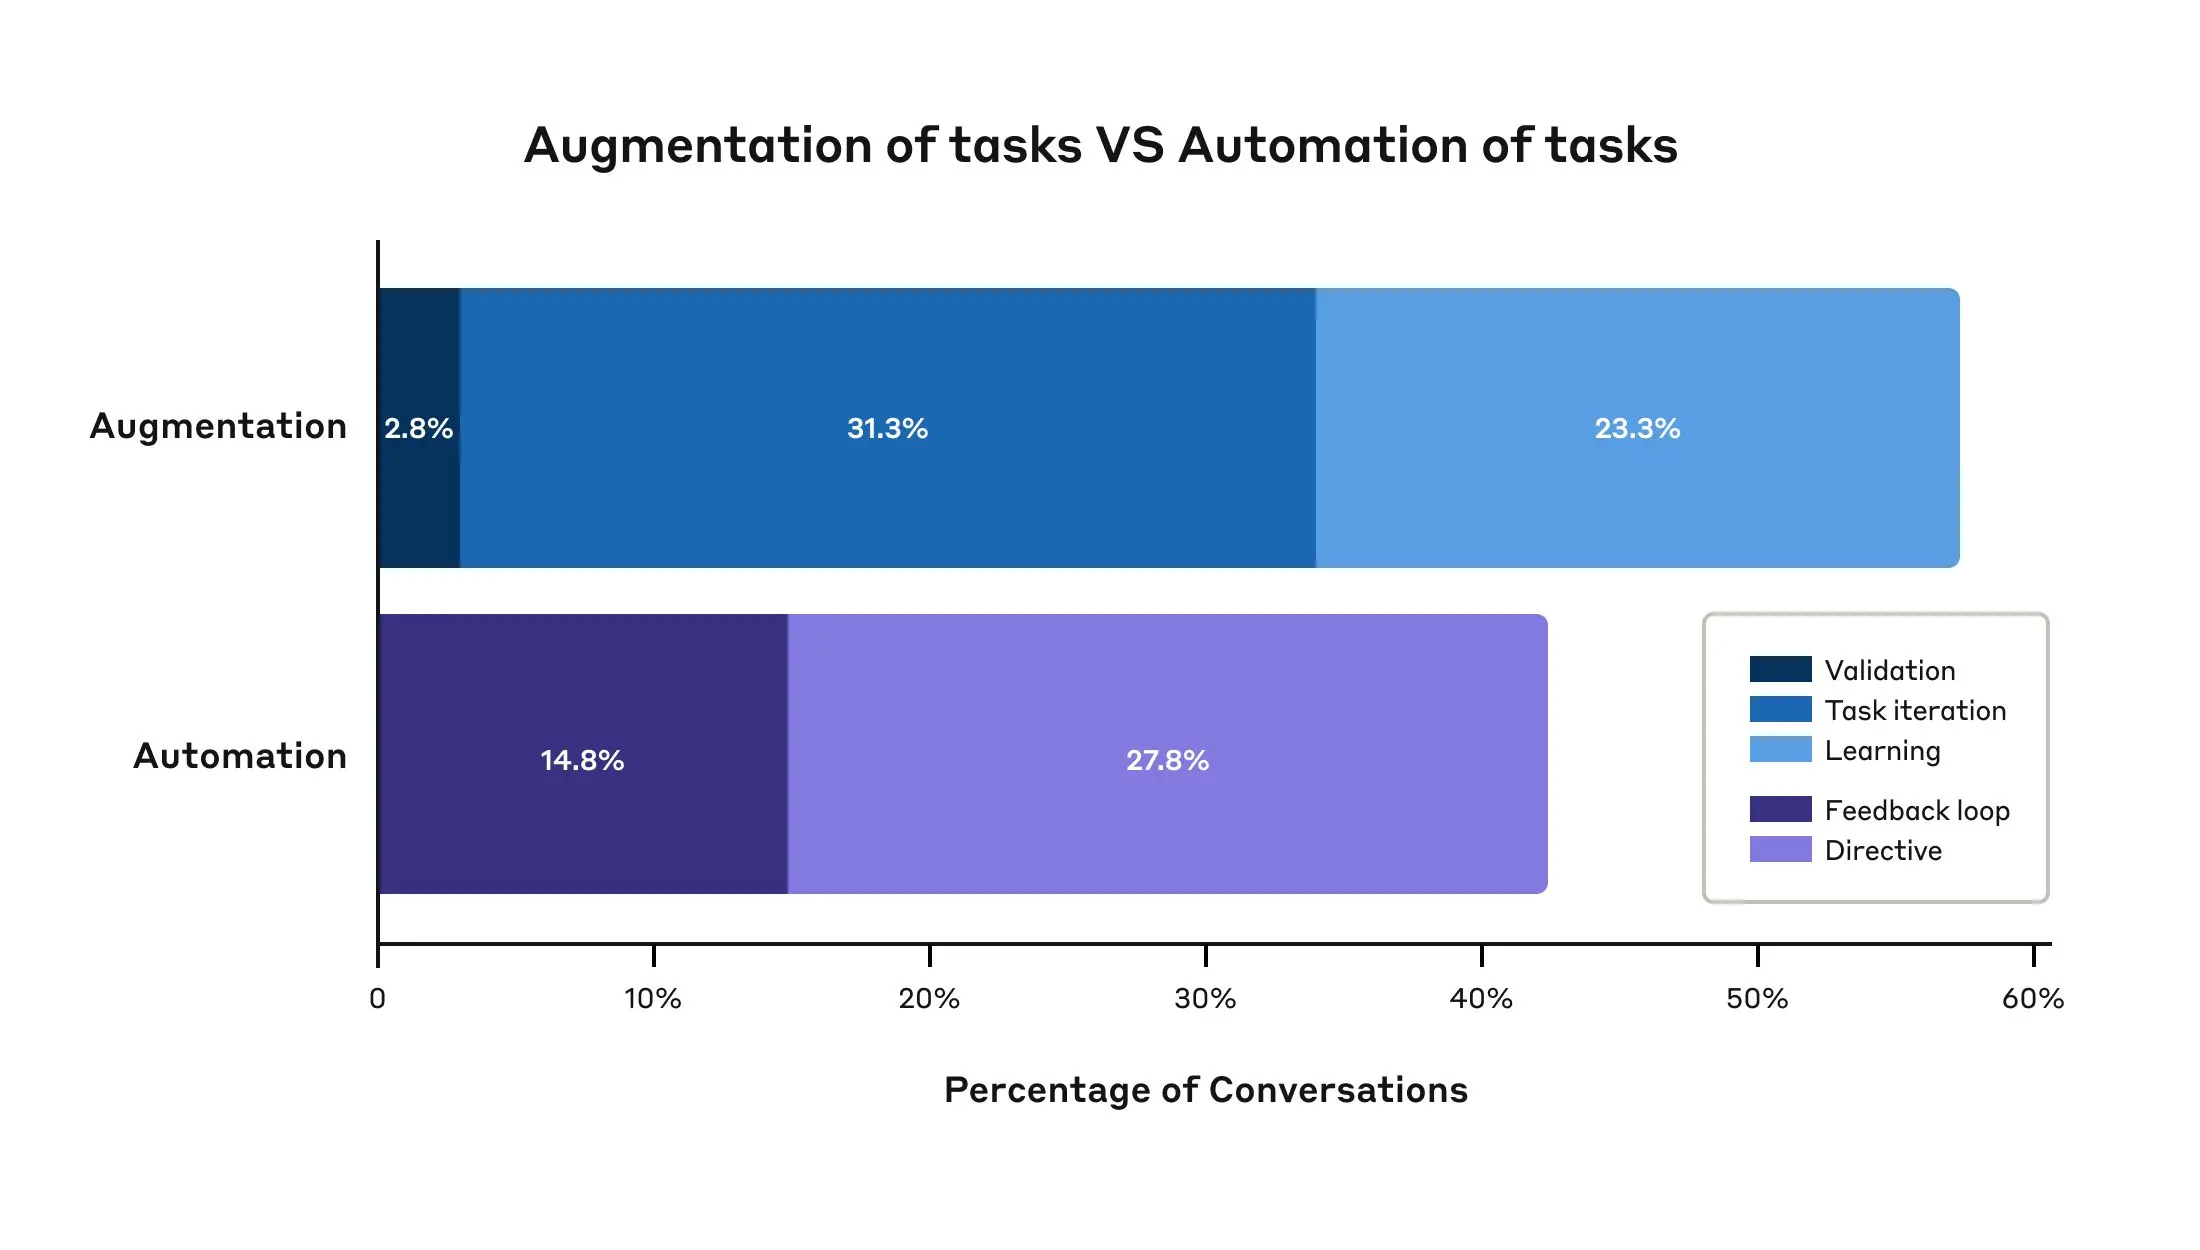
Automation versus augmentation. We also looked in more detail at how the tasks were being performed—specifically, at which tasks involved “automation” (where AI directly performs tasks such as formatting a document) versus “augmentation” (where AI collaborates with a user to perform a task).
Overall, we saw a slight lean towards augmentation, with 57% of tasks being augmented and 43% of tasks being automated. That is, in just over half of cases, AI was not being used to replace people doing tasks, but instead worked with them, engaging in tasks like validation (e.g., double-checking the user’s work), learning (e.g., helping the user acquire new knowledge and skills), and task iteration (e.g., helping the user brainstorm or otherwise doing repeated, generative tasks).
Caveats
Our study provides a unique glimpse into how AI is changing the labor market. But as with all studies it has important limitations. Some of these include:
- We can’t know for certain whether someone using Claude for a task was completing a task for work. Someone asking Claude for writing or editing advice could be doing so at work, but they could also be doing so for the novel they’re writing as a hobby.
- Relatedly, we don’t know how the users were using the responses from Claude. Were they, for instance, copy-pasting code snippets? Were they fact-checking responses or accepting them uncritically? Some of what appears in our data to be automation could, in fact, be augmentation: for example, a user might ask Claude to write a full memo for them (which would appear as automation), but then edit it themselves afterwards (which would be augmentation).
- We also only analyze data from Claude.ai Free and Pro plans, rather than API, Team, or Enterprise users. While Claude.ai data contains some non-work conversations, we used a language model to filter this data to only contain conversations relevant to an occupational task, which helps to mitigate this concern.
- The sheer number of different tasks means it is possible that Clio classified some conversations incorrectly (please see the full paper, in particular Appendix B, for details on how we validated the analysis);
- Claude can’t generate images (except indirectly via code), and so some creative uses won’t be referenced in the data;
- Given that Claude is advertised for use as a state-of-the-art coding model, we might expect coding to be overrepresented as a use case. For that reason, we don’t argue that the uses in our dataset are a representative sample of AI use in general.
Conclusions and future research
AI use is rapidly expanding, and models are becoming ever-more capable. The labor-market picture may look quite different within a relatively short time. For that reason, we’ll repeat many of the analyses above over time to help track the societal and economic changes that are likely to occur. We’ll regularly release the results and the associated datasets as part of the Anthropic Economic Index.
These kinds of longitudinal analyses can give us new insights into AI and the job market. For example, we’ll be able to monitor changes in the depth of AI use within occupations. If it remains the case that AI is used only for certain tasks, and only a few jobs use AI for the vast majority of their tasks, the future might be one where most current jobs evolve rather than disappear. We can also monitor the ratio of automation to augmentation, providing signals of areas where automation is becoming more prevalent.
Our research gives data on how AI is being used, but it doesn’t provide policy prescriptions. Answers to questions about how to prepare for AI’s impact on the labor market can’t come directly from research in isolation; instead, they’ll come from a combination of evidence, values, and experience from broad perspectives. We look forward to using our new methodology to shed more light on these issues.
Read the full paper for more details of our analyses and results.
Open data and call for input
The most important contribution of this paper, and of the Anthropic Economic Index, is its new methodology providing detailed data on the impacts of AI. We’re immediately openly sharing the dataset we used for the above analyses, and we plan to share further such datasets as they become available in the future.
The full dataset can be downloaded here.
A form for researchers to provide feedback on our data and suggest new research directions is here.
Acknowledgements
We appreciate the productive comments and discussion on early findings and drafts of the paper from Jonathon Hazell, Anders Humlum, Molly Kinder, Anton Korinek, Benjamin Krause, Michael Kremer, John List, Ethan Mollick, Lilach Mollick, Arjun Ramani, Will Rinehart, Robert Seamans, Michael Webb, and Chenzi Xu.
Work with us
If you’re interested in working at Anthropic to research the effects of AI on the labor market, we encourage you to apply for our Societal Impacts Research Scientist and Research Engineer roles.
Footnotes
1Clio takes large numbers of conversations and aggregates them into higher-level categories for analysis. Importantly, for the preservation of user privacy it does so without human researchers being able to see the original conversations. You can read more about Clio here.
Related content
Anthropic opens Seoul office and announces new partnerships across the Korean AI ecosystem
Read moreStatement on the US government directive to suspend access to Fable 5 and Mythos 5
The US government has issued an export control directive to suspend all access to Fable 5 and Mythos 5.
Read more